Solar eclipse of October 12, 1977
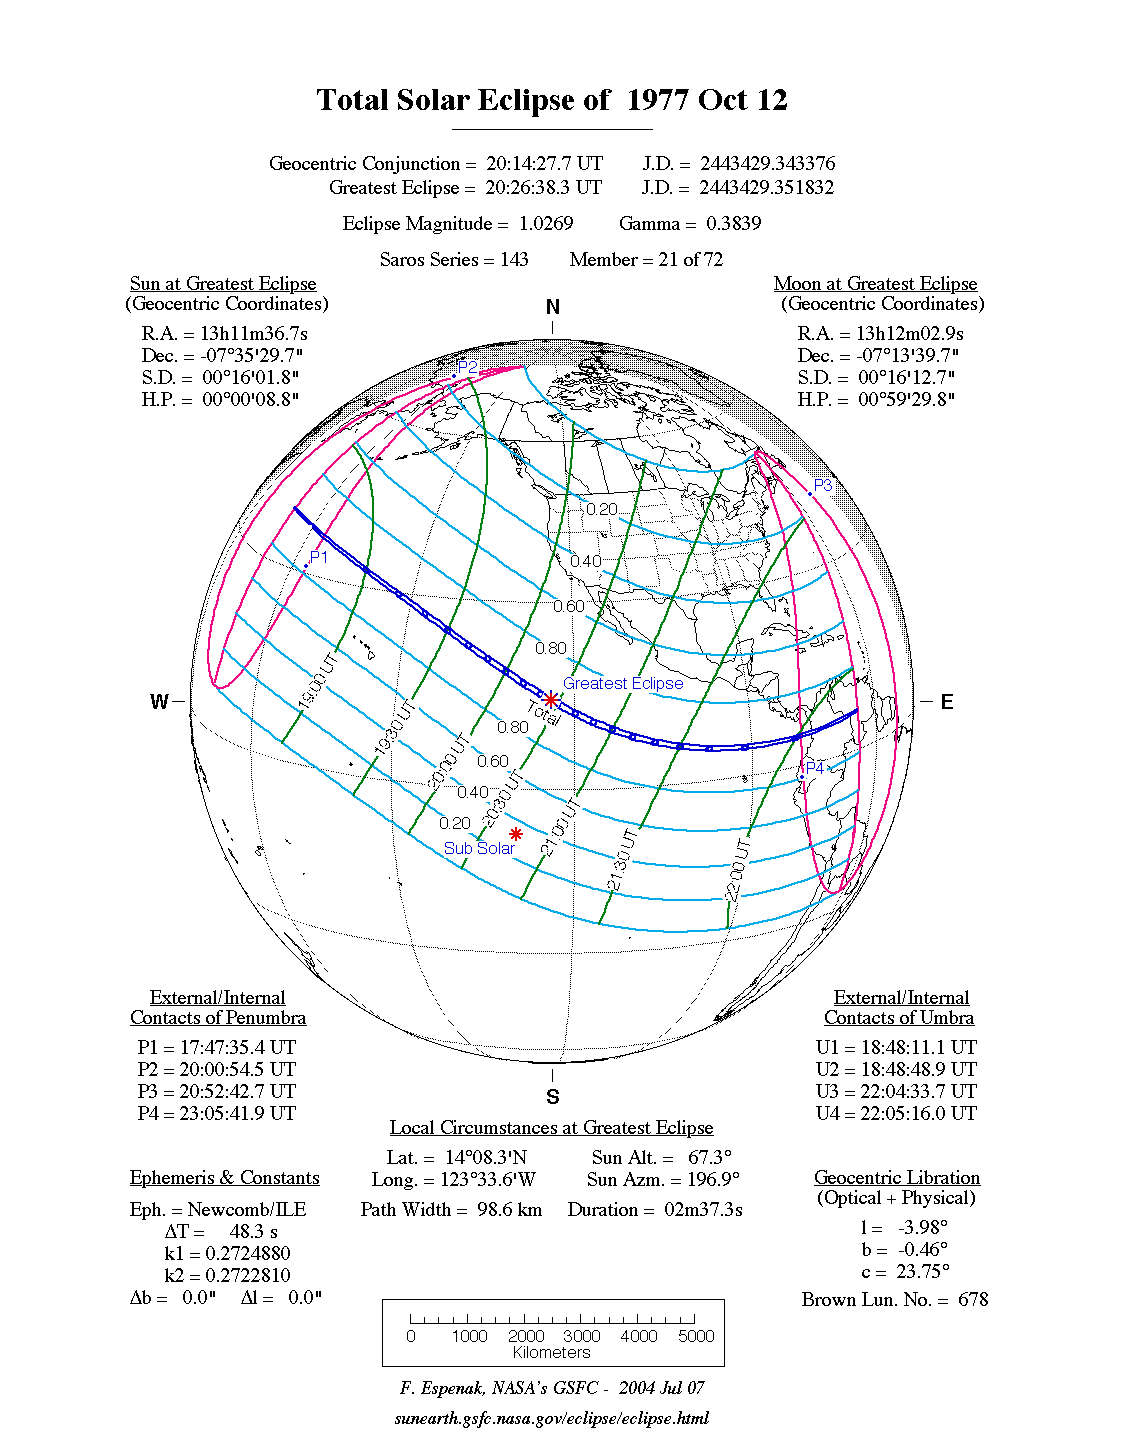
Template:Short description Script error: No such module "Solar eclipse". A total solar eclipse occurred at the Moon's ascending node of orbit on Wednesday, October 12, 1977,[1] with a magnitude of 1.0269. A solar eclipse occurs when the Moon passes between Earth and the Sun, thereby totally or partly obscuring the image of the Sun for a viewer on Earth. A total solar eclipse occurs when the Moon's apparent diameter is larger than the Sun's, blocking all direct sunlight, turning day into darkness. Totality occurs in a narrow path across Earth's surface, with the partial solar eclipse visible over a surrounding region thousands of kilometres wide. Occurring about 2.6 days before perigee (on October 15, 1977, at 10:00 UTC), the Moon's apparent diameter was larger.[2]
Totality was visible in the Pacific Ocean, Colombia and Venezuela. A partial eclipse was visible for parts of North America, Central America, the Caribbean, and northern South America.
Observations
The National Geographic Society funded an expedition by sea led by Jay Pasachoff from Williams College, Massachusetts to the northeast Pacific Ocean to observe the total eclipse. The team took images of the sky and corona during the totality phase as well as corona spectrum and infrared images.[3]
Eclipse details
Shown below are two tables displaying details about this particular solar eclipse. The first table outlines times at which the moon's penumbra or umbra attains the specific parameter, and the second table describes various other parameters pertaining to this eclipse.[4]
| Event | Time (UTC) |
|---|---|
| First Penumbral External Contact | 1977 October 12 at 17:48:24.0 UTC |
| First Umbral External Contact | 1977 October 12 at 18:48:59.6 UTC |
| First Central Line | 1977 October 12 at 18:49:18.4 UTC |
| First Umbral Internal Contact | 1977 October 12 at 18:49:37.3 UTC |
| First Penumbral Internal Contact | 1977 October 12 at 20:01:41.4 UTC |
| Equatorial Conjunction | 1977 October 12 at 20:15:17.1 UTC |
| Greatest Eclipse | 1977 October 12 at 20:27:27.3 UTC |
| Greatest Duration | 1977 October 12 at 20:30:55.5 UTC |
| Ecliptic Conjunction | 1977 October 12 at 20:31:29.7 UTC |
| Last Penumbral Internal Contact | 1977 October 12 at 20:53:33.8 UTC |
| Last Umbral Internal Contact | 1977 October 12 at 22:05:23.4 UTC |
| Last Central Line | 1977 October 12 at 22:05:44.5 UTC |
| Last Umbral External Contact | 1977 October 12 at 22:06:05.6 UTC |
| Last Penumbral External Contact | 1977 October 12 at 23:06:31.5 UTC |
| Parameter | Value |
|---|---|
| Eclipse Magnitude | 1.02694 |
| Eclipse Obscuration | 1.05462 |
| Gamma | 0.38363 |
| Sun Right Ascension | 13h11m36.7s |
| Sun Declination | -07°35'30.0" |
| Sun Semi-Diameter | 16'01.8" |
| Sun Equatorial Horizontal Parallax | 08.8" |
| Moon Right Ascension | 13h12m03.0s |
| Moon Declination | -07°13'40.8" |
| Moon Semi-Diameter | 16'12.7" |
| Moon Equatorial Horizontal Parallax | 0°59'29.8" |
| ΔT | 48.3 s |
Eclipse season
Script error: No such module "Labelled list hatnote". This eclipse is part of an eclipse season, a period, roughly every six months, when eclipses occur. Only two (or occasionally three) eclipse seasons occur each year, and each season lasts about 35 days and repeats just short of six months (173 days) later; thus two full eclipse seasons always occur each year. Either two or three eclipses happen each eclipse season. In the sequence below, each eclipse is separated by a fortnight.
| September 27 Descending node (full moon) |
October 12 Ascending node (new moon) |
|---|---|
| File:Lunar eclipse chart close-1977Sep27.png | File:SE1977Oct12T.png |
| Penumbral lunar eclipse Lunar Saros 117 |
Total solar eclipse Solar Saros 143 |


Related eclipses
Eclipses in 1977
- A partial lunar eclipse on April 4.
- An annular solar eclipse on April 18.
- A penumbral lunar eclipse on September 27.
- A total solar eclipse on October 12.
Metonic
- Preceded by: Solar eclipse of December 24, 1973
- Followed by: Solar eclipse of July 31, 1981
Tzolkinex
- Preceded by: Solar eclipse of August 31, 1970
- Followed by: Solar eclipse of November 22, 1984
Half-Saros
- Preceded by: Lunar eclipse of October 6, 1968
- Followed by: Lunar eclipse of October 17, 1986
Tritos
- Preceded by: Solar eclipse of November 12, 1966
- Followed by: Solar eclipse of September 11, 1988
Solar Saros 143
- Preceded by: Solar eclipse of October 2, 1959
- Followed by: Solar eclipse of October 24, 1995
Inex
- Preceded by: Solar eclipse of November 1, 1948
- Followed by: Solar eclipse of September 22, 2006
Triad
- Preceded by: Solar eclipse of December 12, 1890
- Followed by: Solar eclipse of August 12, 2064
Solar eclipses of 1975–1978
This eclipse is a member of a semester series. An eclipse in a semester series of solar eclipses repeats approximately every 177 days and 4 hours (a semester) at alternating nodes of the Moon's orbit.[5]
| Solar eclipse series sets from 1975 to 1978 | ||||||
|---|---|---|---|---|---|---|
| Descending node | Ascending node | |||||
| Saros | Map | Gamma | Saros | Map | Gamma | |
| 118 | May 11, 1975 File:SE1975May11P.png Partial |
1.0647 | 123 | November 3, 1975 File:SE1975Nov03P.png Partial |
−1.0248 | |
| 128 | April 29, 1976 File:SE1976Apr29A.png Annular |
0.3378 | 133 | October 23, 1976 File:SE1976Oct23T.png Total |
−0.327 | |
| 138 | April 18, 1977 File:SE1977Apr18A.png Annular |
−0.399 | 143 | October 12, 1977 File:SE1977Oct12T.png Total |
0.3836 | |
| 148 | April 7, 1978 File:SE1978Apr07P.png Partial |
−1.1081 | 153 | October 2, 1978 File:SE1978Oct02P.png Partial |
1.1616 | |


Saros 143
This eclipse is a part of Saros series 143, repeating every 18 years, 11 days, and containing 72 events. The series started with a partial solar eclipse on March 7, 1617. It contains total eclipses from June 24, 1797 through October 24, 1995; hybrid eclipses from November 3, 2013 through December 6, 2067; and annular eclipses from December 16, 2085 through September 16, 2536. The series ends at member 72 as a partial eclipse on April 23, 2897. Its eclipses are tabulated in three columns; every third eclipse in the same column is one exeligmos apart, so they all cast shadows over approximately the same parts of the Earth.
The longest duration of totality was produced by member 16 at 3 minutes, 50 seconds on August 19, 1887, and the longest duration of annularity will be produced by member 51 at 4 minutes, 54 seconds on September 6, 2518. All eclipses in this series occur at the Moon’s ascending node of orbit.[6]
| Series members 12–33 occur between 1801 and 2200: | ||
|---|---|---|
| 12 | 13 | 14 |
| File:SE1815Jul06T.png July 6, 1815 |
File:SE1833Jul17T.png July 17, 1833 |
File:SE1851Jul28T.png July 28, 1851 |
| 15 | 16 | 17 |
| File:SE1869Aug07T.png August 7, 1869 |
File:SE1887Aug19T.png August 19, 1887 |
File:SE1905Aug30T.png August 30, 1905 |
| 18 | 19 | 20 |
| File:SE1923Sep10T.png September 10, 1923 |
File:SE1941Sep21T.png September 21, 1941 |
File:SE1959Oct02T.png October 2, 1959 |
| 21 | 22 | 23 |
| File:SE1977Oct12T.png October 12, 1977 |
File:SE1995Oct24T.png October 24, 1995 |
File:SE2013Nov03H.png November 3, 2013 |
| 24 | 25 | 26 |
| File:SE2031Nov14H.png November 14, 2031 |
File:SE2049Nov25H.png November 25, 2049 |
File:SE2067Dec06H.png December 6, 2067 |
| 27 | 28 | 29 |
| File:SE2085Dec16A.png December 16, 2085 |
File:SE2103Dec29A.png December 29, 2103 |
File:SE2122Jan08A.png January 8, 2122 |
| 30 | 31 | 32 |
| File:SE2140Jan20A.png January 20, 2140 |
File:SE2158Jan30A.png January 30, 2158 |
File:SE2176Feb10A.png February 10, 2176 |
| 33 | ||
| File:SE2194Feb21A.png February 21, 2194 | ||


Metonic series
The metonic series repeats eclipses every 19 years (6939.69 days), lasting about 5 cycles. Eclipses occur in nearly the same calendar date. In addition, the octon subseries repeats 1/5 of that or every 3.8 years (1387.94 days). All eclipses in this table occur at the Moon's ascending node.


Tritos series
Template:Solar Tritos series 2010 July 11
Inex series
Template:Solar Inex series 2006 September 22
Notes
<templatestyles src="Reflist/styles.css" />
Script error: No such module "Check for unknown parameters".
References
- Earth visibility chart and eclipse statistics Eclipse Predictions by Fred Espenak, NASA/GSFC
Script error: No such module "Navbox". Script error: No such module "Side box".